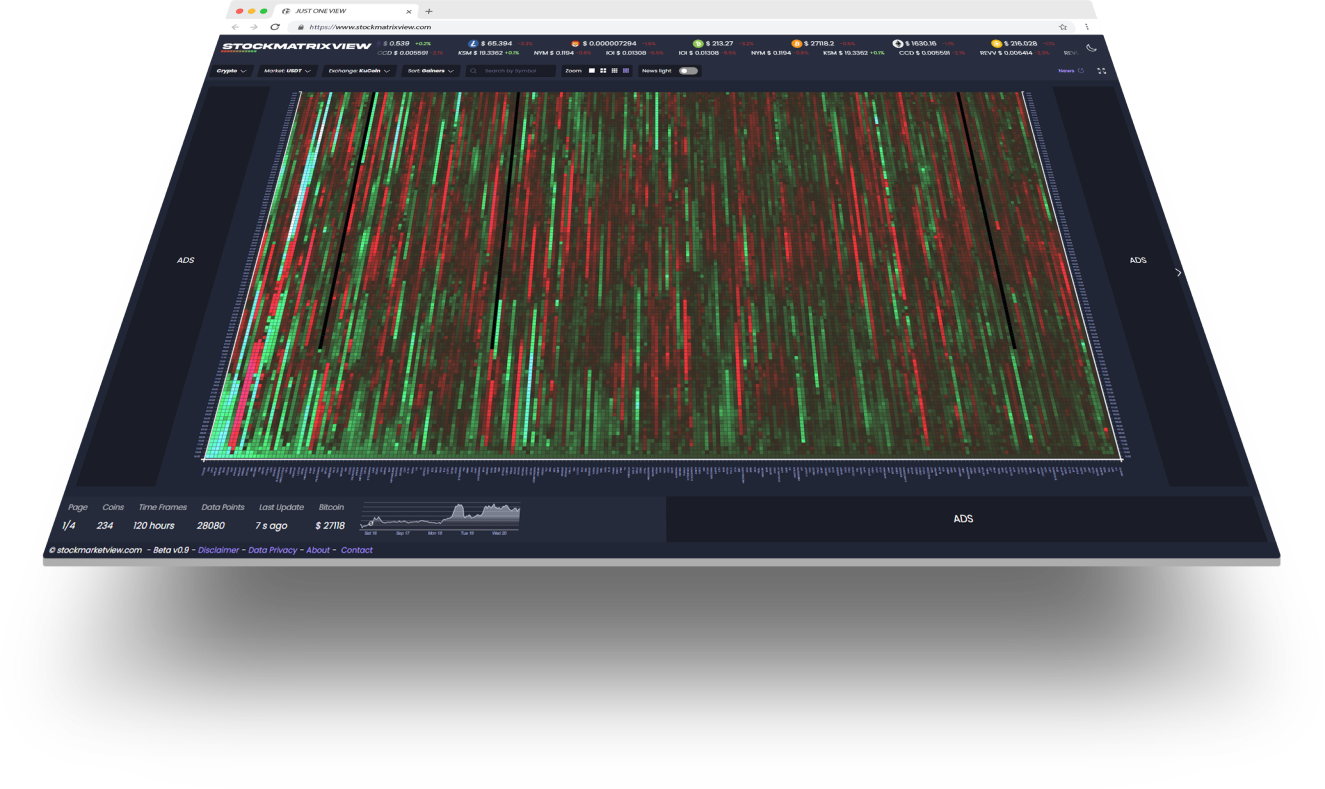
Explanation stockmatrixview

The Matrix
The colors of the matrix represents the 24 hours percentage change of the price.
x - Axis
Each column represents one share of the respective company.
y - Axis
Each line represents the time at which the 24 hour percentage difference was recorded.
The footer
In the footer more information about the number of contained values, the leading index and its chart is displayed. The period of the chart extends over the time span of the matrix.
Enough scrolling now. Let's get back to the matrix.
© stockmatrixview.com Beta v0.9About-How to-Features-Feedback-Disclaimer- Contact -Privacy Policy-Cookie Policy